What happened
On 31 August 2023 the Cambridge Centre for Alternative Finance published Bitcoin electricity consumption: an improved assessment and restated the whole back series of its Bitcoin Electricity Consumption Index. The 2021 figure falls from 104.0 to 89.0 TWh. The 2022 figure falls from 105.3 to 95.5 TWh. The year-to-date 2023 figure falls from 75.7 to 70.4 TWh.
No block changed. No machine was switched off. The revision is entirely a change in what the model assumes about the hardware doing the hashing.
What it changes
It makes visible the step that most published energy figures skip over. The chain publishes hashrate, not watts. Difficulty and block timestamps tell you how much work miners did. They say nothing at all about the efficiency of the machines that did it, and efficiency is the entire conversion factor between the two.
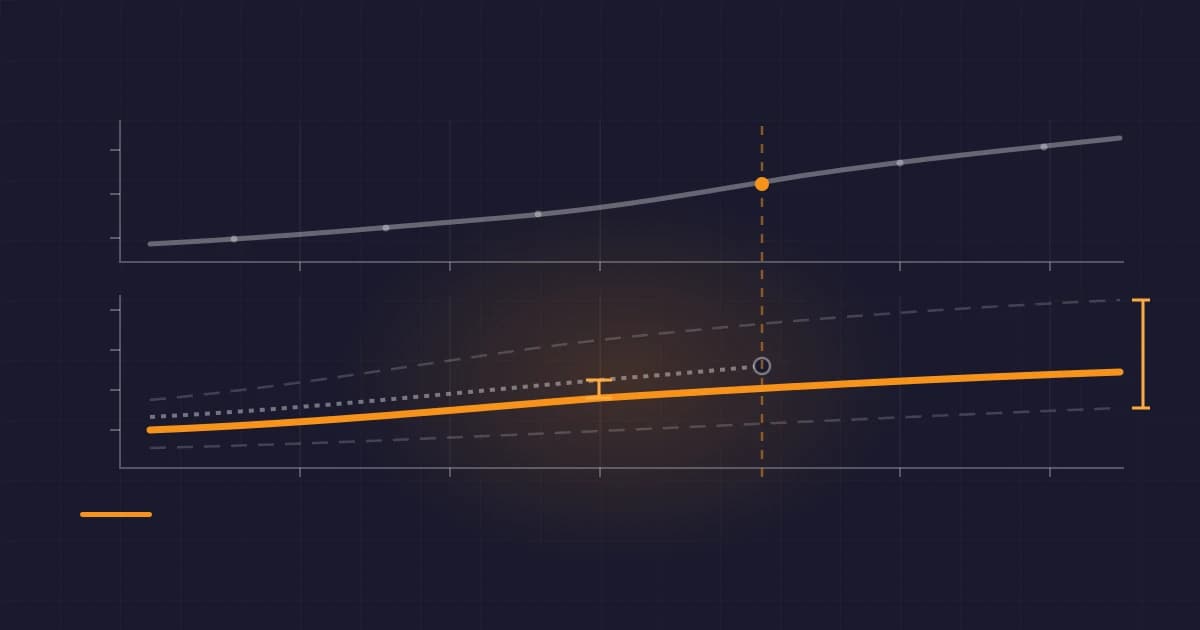
Cambridge closes that gap by assuming a fleet. Take the observed hashrate, assume it is produced by some mix of the ASIC models on the market, discard the ones that would not be profitable at an assumed electricity price (0.05 USD/kWh by default), weight what is left, then multiply by an overhead factor for cooling and power delivery. The methodology page sets out each step.
The old version weighted every profitable model released in the previous five years equally, which stuffed the imaginary fleet with old, thirsty machines. The new version weights newer hardware more heavily and adds a two-month lag between a model's release and it being plugged in. That one change moves the 2021 estimate by about 14 percent.
What it does not change
Bitcoin still uses a large amount of electricity, and the index still says so. This is a correction to a measurement, not a discovery that the measurement was pointless.
It also does not narrow the honest range. Cambridge publishes a floor (the whole network running the single most efficient machine available) and a ceiling (the least efficient machine still worth running), and the gap between them is wide by construction. Anyone quoting one number without saying which of the three it is, and on what date, is quoting a model output as though it were a meter reading.
And it does not make the underlying quantity observable. Which machines are installed, and where, is private commercial information. Every figure in this argument, on either side of it, is a model fed by an assumption about that.
Context
The index has been the standard citation since 2019, which is part of why the revision matters: many published claims trace back to this one series.
Governments are already working with ranges rather than numbers. The White House Office of Science and Technology Policy report Climate and Energy Implications of Crypto-Assets in the United States, published in September 2022, put Bitcoin's global electricity use at 90 to 145 billion kWh per year with a theoretical range of 40 to 180. That report notes that the distance between its own upper and lower bounds has been growing, and says plainly that the gap reflects uncertainty about which rigs are profitable to run at a given price.
The network side has moved fast enough to make any fixed number stale. Daily average hashrate was about 88 EH/s on 3 July 2021, at the bottom of the Chinese mining ban, and about 345 EH/s today (mempool.space). Meanwhile each generation of hardware does more work per joule than the last. The two effects pull the electricity total in opposite directions, which is precisely why the fleet assumption, and not the hashrate, decides the answer.